A dashboard full of impressions, clicks, and platform-reported conversions can look busy and tell you almost nothing about whether the business is healthy. A revenue-focused dashboard answers a narrower, more useful question: for the money we spent, what customer outcomes did we actually get, and are those outcomes profitable once you account for real costs. This lesson defines the small set of metrics worth tracking and shows how to avoid the most common dashboard mistake, double-counting revenue across platforms that each claim credit for the same sale.
Why fewer metrics, defined precisely, beat more metrics
Every ad platform reports its own version of conversions, revenue, and ROAS (return on ad spend), usually using an attribution model that favors that platform. If you pull every platform's number onto one dashboard without reconciling them, you'll often find the sum of 'attributed revenue' across channels exceeds total actual revenue, sometimes by a wide margin. A smaller dashboard with explicitly defined, reconciled metrics is more trustworthy than a large one stitched together from unreconciled platform exports.
The core metrics to define
CAC: customer acquisition cost
CAC is total acquisition cost (ad spend plus relevant marketing labor or agency fees, depending on how your business defines it) divided by new customers acquired in the same period. State explicitly whether CAC includes only media spend or also includes salaries, tools, and agency fees, since both are legitimate definitions but produce very different numbers.
Payback period
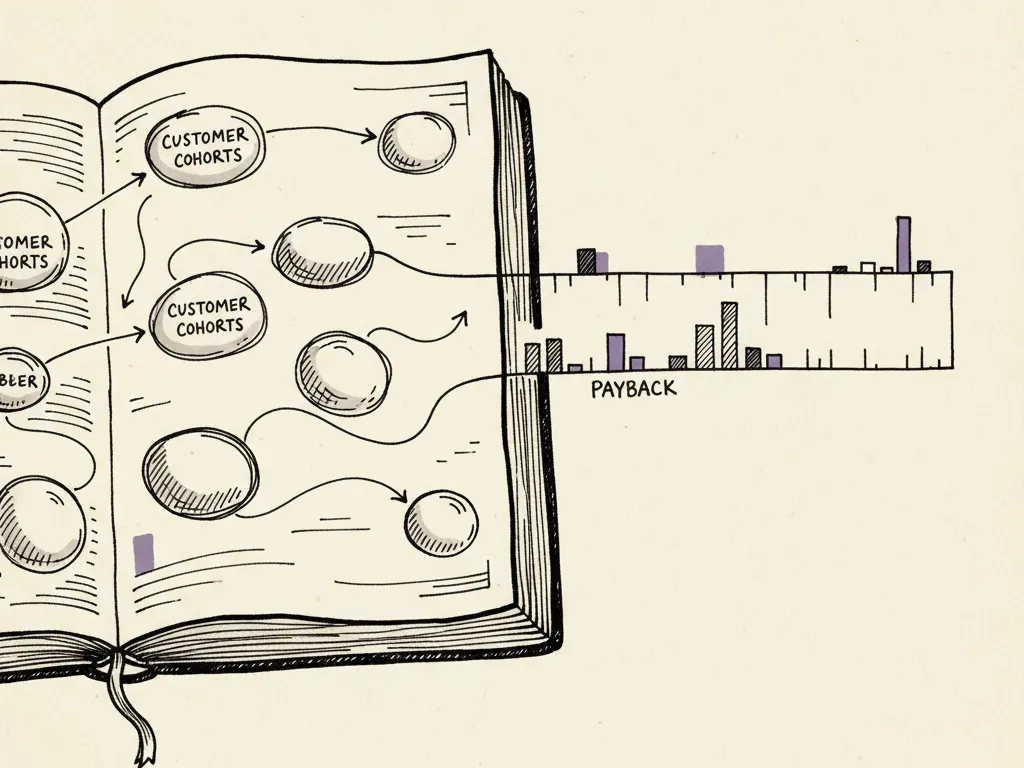
Payback period is how long it takes the gross profit from a customer to cover their CAC. It is typically expressed in months. This matters more than CAC alone for businesses with recurring revenue or repeat purchase, since a higher CAC can be fine if payback is fast and LTV (lifetime value) is high.
LTV: lifetime value
LTV is the gross profit (not revenue) a customer generates over a defined period, commonly 12 or 24 months, or over their estimated full relationship with the business. Always state the time window and whether the figure is revenue or gross profit, since using revenue instead of profit overstates how much you can afford to spend acquiring a customer.
Lead quality
For businesses with a sales process between a lead and a sale, raw lead volume is a weak signal. Lead quality metrics (percentage of leads that become sales-qualified, percentage that convert to paying customers) catch channels that generate volume without generating revenue.
Blended CAC
Blended CAC is total marketing spend across all channels divided by total new customers in the period, regardless of which channel each platform claims credit for. It is a useful sanity check against the sum of individual channel-reported CACs, which often understate the true blended figure because of overlapping attribution claims.
Avoiding double-counted revenue
If Meta reports $20,000 in attributed revenue and Google reports $15,000 in attributed revenue for the same month, and your actual sales system shows $28,000 in total revenue, you have $7,000 of double-counted or over-attributed credit between the two platforms. Reconcile dashboard numbers against your own sales or billing system's total revenue, and treat each platform's attributed figure as a directional signal about which channel to invest in, not as literal incremental revenue.
Documenting sources and timing
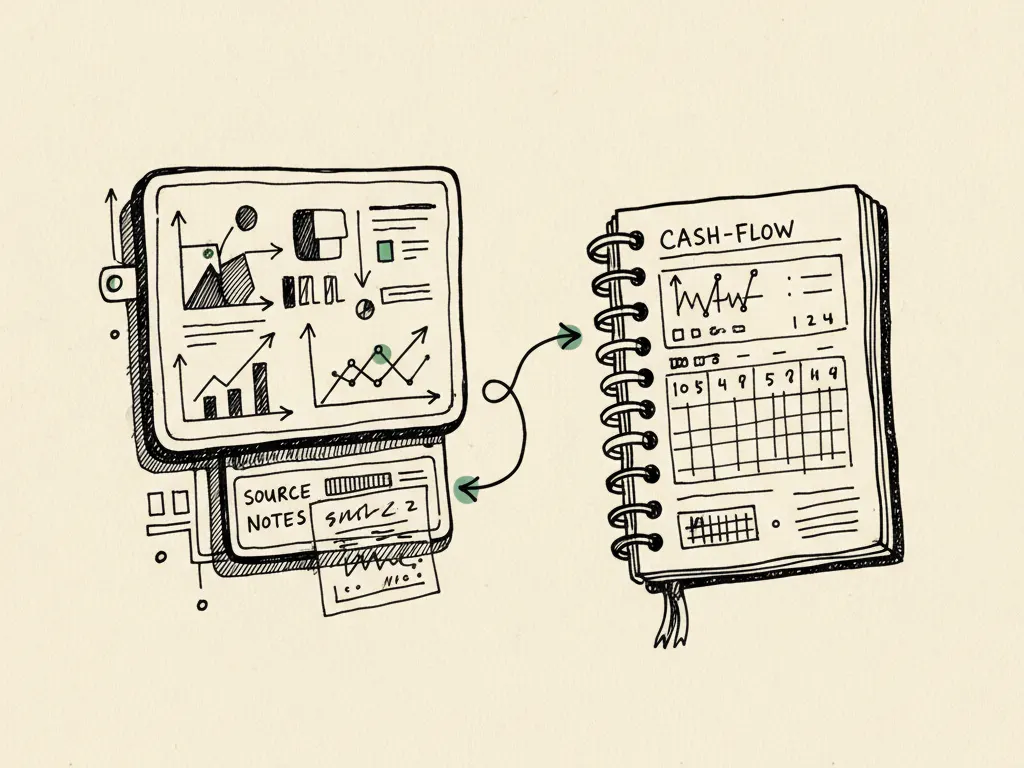
For every metric on the dashboard, record where the data comes from (which platform, which report, or which internal system) and how often it refreshes. This single habit resolves most dashboard disputes: when two people disagree on a number, the fix is usually checking whether they are looking at different time windows or different source systems, not a flaw in the metric itself.
Your dashboard table and metric dictionary
The deliverable for this lesson is two parts: a hypothetical dashboard table with a row per metric, and a metric dictionary defining each one precisely. Below is a template table using illustrative figures only.
| Metric | This month (illustrative) | Data source | Refresh timing |
|---|---|---|---|
| Total marketing spend | $7,000 | Billing records across all channels | Weekly |
| New customers | 20 | Internal sales/billing system | Daily |
| Blended CAC | $350 | Calculated: spend ÷ new customers | Weekly |
| Gross-profit LTV (12 month) | $900 | Billing + product margin data | Monthly |
| Payback period | 4.7 months | Calculated: CAC ÷ monthly gross profit per customer | Monthly |
| Lead-to-customer rate | 18% | CRM | Weekly |
Illustrative values only, not a client result or benchmark. The gap between platform-reported and blended CAC usually reflects overlapping attribution credit, not a measurement error on either platform.
Building your metric dictionary
- Name and plain-English definition of the metric
- Exact formula, including whether it uses revenue or gross profit
- Time window the metric covers (e.g. trailing 30 days, 12-month LTV)
- Data source and how often it refreshes
- Known limitations (e.g. this platform's attribution window, what it does not capture)
- Who owns the metric and who to ask if a number looks wrong
Common mistakes
- Summing each platform's attributed revenue and treating the total as actual business revenue.
- Using revenue instead of gross profit when calculating LTV, which overstates affordable CAC.
- Leaving metric definitions implicit, so different team members quietly use different formulas or time windows.
- Tracking a large number of vanity metrics (impressions, reach) on the same dashboard as the handful of decision-relevant ones, burying the signal.
- Never reconciling platform-reported numbers against the business's own sales or billing system.
When this is not the right tactic
A full CAC/LTV/payback dashboard is more than a brand-new business with only a handful of sales needs; at that stage, a simple spreadsheet tracking spend and sales by source is enough until there is sufficient volume to calculate meaningful averages. It is also not the right starting point if the business has no reliable system for tracking actual customer revenue yet; fix that data foundation first, since a dashboard built on unreliable source data will produce confident-looking but wrong numbers.
Where to go next
Once your dashboard is reconciled and defined, the next step is applying these metrics inside structured experiments, covered in the lesson on A/B testing basics, so changes to spend or creative can be evaluated against the same honest baseline this dashboard establishes.