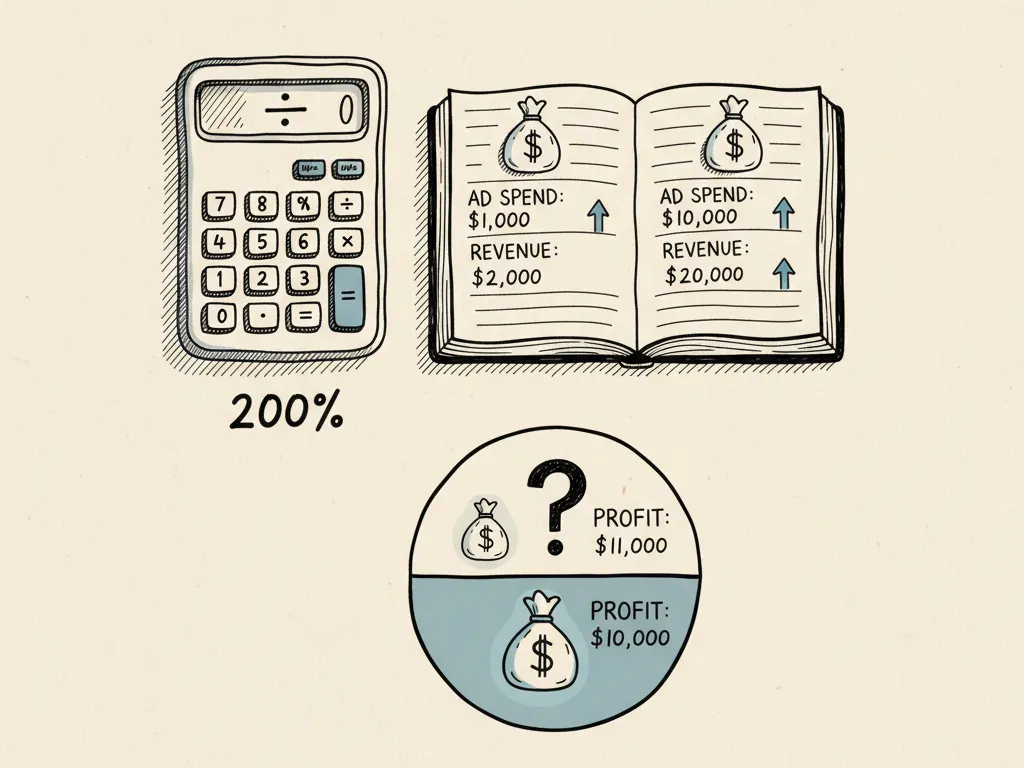
Average return on ad spend (ROAS, attributed revenue divided by ad spend) is the number most dashboards show first, and it is the number most founders use to decide whether to scale a campaign. The problem is that average ROAS is a backward-looking blend of every dollar already spent, including the cheap, high-performing dollars from early audience segments and keywords. It does not tell you what the next dollar, the marginal dollar, is likely to return. Scaling decisions should be based on marginal economics: the expected return on the increment of spend you are about to add.
Average versus marginal return
Imagine a campaign spending $5,000 a day with an average ROAS of 4.0x. That average is made up of many different 'units' of spend: some went to warm retargeting audiences converting at very high rates, some went to broad prospecting converting at lower rates. If you add another $1,000 a day, that increment is mostly bidding into the next-best available inventory, which is, by definition, less efficient than the inventory already being bought. The marginal ROAS on that $1,000 increment is very often lower than the average ROAS of the existing $5,000, even when both numbers are 'real' and correctly measured.
This is not a flaw in tracking; it is how auction-based paid media works. Platforms generally serve the most efficient opportunities to a campaign first, then progressively less efficient opportunities as budget increases, because the pool of people likely to convert at the best price is limited. Recognizing this pattern is the core skill behind responsible scaling.
What drives the fall in marginal return
- Audience saturation: the same accessible audience sees your ads more often, and new, equally relevant people become scarcer as spend rises.
- Creative capacity: a small set of ad variants cannot absorb unlimited spend without frequency rising and performance softening (see the companion article on creative fatigue).
- Auction competition: bidding more aggressively usually means competing for less favorable auction positions against other advertisers.
- Operational capacity: a service business may be unable to fulfil more leads at the same quality without hiring, which is a real constraint even when the ad platform could technically deliver more clicks.
Building a spend-response table
The most practical tool for this decision is a spend-response table: a hypothetical or observed set of budget levels with the expected or measured revenue, cost, and incremental return at each step. Rather than asking 'is ROAS good', ask 'what is the marginal ROAS between this spend level and the next one'.
| Daily spend | Attributed revenue | Average ROAS | Marginal ROAS vs prior step |
|---|---|---|---|
| $3,000 | $15,000 | 5.0x | — |
| $5,000 | $21,000 | 4.2x | 3.0x |
| $7,000 | $25,000 | 3.6x | 2.0x |
Setting hold, reduce, and scale rules
Because attributed revenue is noisy and incremental lift is even harder to measure precisely, treat marginal ROAS as a range, not a single number, and give each decision a minimum observation window (commonly 5-14 days depending on sales cycle and volume) before acting. A workable framework ties the decision to contribution margin and to cash-flow limits, not only to a target ROAS.
| Signal observed over the window | Likely action |
|---|---|
| Marginal ROAS clearly above break-even ROAS and fulfilment capacity exists | Scale in a modest increment, then re-measure |
| Marginal ROAS near break-even ROAS, or capacity constrained | Hold spend, invest in new creative or audiences instead |
| Marginal ROAS below break-even ROAS for the full window | Reduce the increment back to the prior profitable level |
| Measurement too noisy to read (low volume, short window) | Hold and extend the observation window before deciding |
Respecting margin and cash-flow limits
A marginal ROAS above the break-even ROAS is necessary but not sufficient to scale. Two further constraints matter. First, contribution margin: break-even ROAS is 1 divided by contribution margin, so a lower-margin product requires a higher ROAS to be worth scaling at all, and that threshold should be written down before testing increments. Second, cash flow: ad platforms are typically billed before revenue is collected, and for businesses with payment terms, financing, or seasonal cash cycles, a mathematically profitable increment can still strain working capital if growth outpaces collections. Scaling plans should include a stated cash buffer, not just a ROAS target.
A simple scaling framework
- 1Define contribution margin and the resulting break-even ROAS for the product or offer
- 2Record current spend and average ROAS, then propose one spend increment (commonly 15-30%)
- 3Run the increment for a fixed observation window and calculate marginal ROAS for that step alone
- 4Compare marginal ROAS to break-even ROAS and to fulfilment and cash-flow capacity
- 5Apply the hold/reduce/scale rule and document the decision with the numbers behind it
Common mistakes
- Scaling budget based on average ROAS alone, ignoring that the next dollar performs differently from the existing blend.
- Increasing spend in large jumps (doubling or more) instead of measured increments, making it impossible to isolate the marginal effect.
- Confusing a healthy ROAS with a healthy profit, when margin, refunds, and other marketing costs are not accounted for.
- Ignoring creative and audience capacity, then blaming 'the algorithm' when performance softens after a budget increase.
- Reacting to a single day or a small sample instead of a defined observation window.
When this is not the right tactic
Marginal-economics scaling assumes you already have a reasonably reliable measurement setup and enough volume to observe a meaningful marginal effect; very low-spend accounts or brand-new campaigns with only a handful of conversions will not produce a trustworthy spend-response table, and a simpler 'test small, learn, then decide' approach fits better until volume grows. It is also less relevant for brand or awareness objectives where the direct-response ROAS framing does not apply at all, and for businesses with hard operational ceilings (a single clinic with limited appointment slots, for example) where the real constraint is capacity, not ad economics.